
Linear regression is used for predicting a continuous dependent variable based on one or more independent variables. It’s one of the simplest and most widely used algorithms for predictive analysis.
Here is an example of how you can implement Linear Regression in Python using the popular machine learning library scikit-learn. This example includes creating a simple dataset, training a Linear Regression model, and making predictions.
# Import necessary libraries
import numpy as np
import matplotlib.pyplot as plt
from sklearn.model_selection import train_test_split
from sklearn.linear_model import LinearRegression
from sklearn.metrics import mean_squared_error, r2_score
# Generate a simple dataset
# Let's create a dataset with a linear relationship
np.random.seed(0)
X = 2 * np.random.rand(100, 1) # Features
y = 4 + 3 * X + np.random.randn(100, 1) # Labels
# Split the dataset into training and testing sets
X_train, X_test, y_train, y_test = train_test_split(X, y, test_size=0.2, random_state=42)
# Create a Linear Regression model
model = LinearRegression()
# Train the model using the training data
model.fit(X_train, y_train)
# Make predictions using the testing data
y_pred = model.predict(X_test)
# Evaluate the model
mse = mean_squared_error(y_test, y_pred)
r2 = r2_score(y_test, y_pred)
print("Mean Squared Error (MSE):", mse)
print("R-squared (R2) Score:", r2)
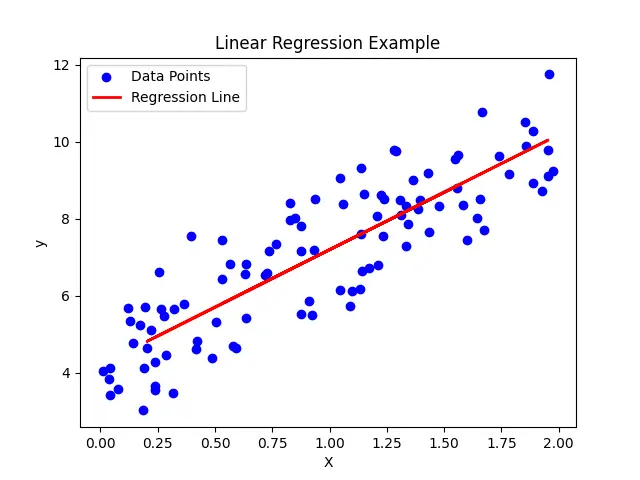
# Plot the results
plt.scatter(X, y, color='blue', label='Data Points')
plt.plot(X_test, y_pred, color='red', linewidth=2, label='Regression Line')
plt.xlabel('X')
plt.ylabel('y')
plt.legend()
plt.title('Linear Regression Example')
plt.show()Output of above Linear Regression Program
Mean Squared Error (MSE): 0.9177532469714291
R-squared (R2) Score: 0.6521157503858556
Explanation:
- Import necessary libraries:
numpyfor numerical operations.matplotlib.pyplotfor plotting.sklearn.model_selection.train_test_splitfor splitting the dataset into training and testing sets.sklearn.linear_model.LinearRegressionfor creating the Linear Regression model.sklearn.metricsfor evaluating the model’s performance.
- Generate a simple dataset:
- Create a dataset with a linear relationship using
numpy. Xrepresents the feature(s) andyrepresents the target variable.
- Create a dataset with a linear relationship using
- Split the dataset:
- Use
train_test_splitto split the dataset into training and testing sets. 80% of the data is used for training and 20% for testing.
- Use
- Create and train the model:
- Instantiate the
LinearRegressionmodel. - Fit the model using the training data.
- Instantiate the
- Make predictions:
- Use the trained model to make predictions on the testing data.
- Evaluate the model:
- Calculate the Mean Squared Error (MSE) and the R-squared (R2) score to evaluate the model’s performance.
- Plot the results:
- Plot the original data points and the regression line to visualize the relationship.
This code will output the MSE and R2 score, giving you an idea of the model’s accuracy, and it will plot the regression line along with the original data points.
Article Contributors
![]()
Subscribe to QABash Monthly Newsletter
Dominate – Stay Ahead of 99% Testers!